In spring 2021, I visited Echo Amphitheater, a naturally formed amphitheater near Abuiquiu, New Mexico. The site has never (to my knowledge) been studied for its acoustical properties. To gain a better sense of the exotic acoustics of the amphitheater, I recorded myself clapping my hands four times with a TASCAM DR-05 field recorder. Below is the original data, as well as (limited) analysis of the echo times, decay, and bandpass of the canyon. As I learn more about acoustics, I hope to more carefully analyze the data, and maybe visit the canyon again.
Table of Contents
Below are the four handclaps. Feel free to download, share, analyze, etc.
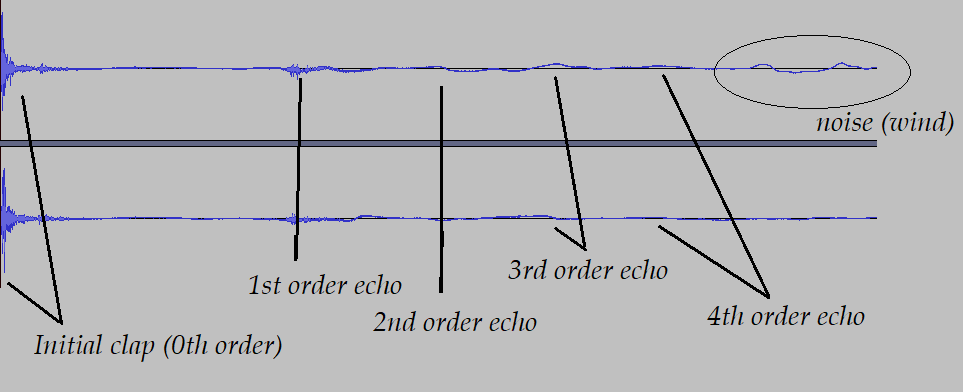
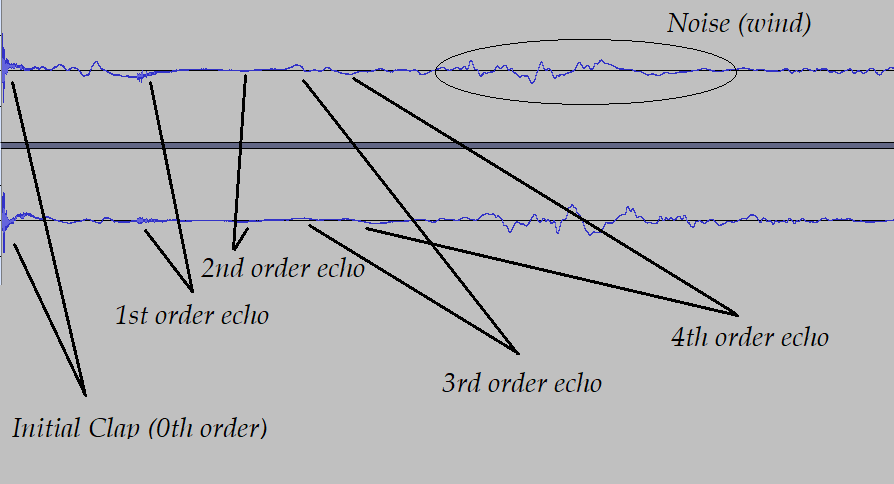
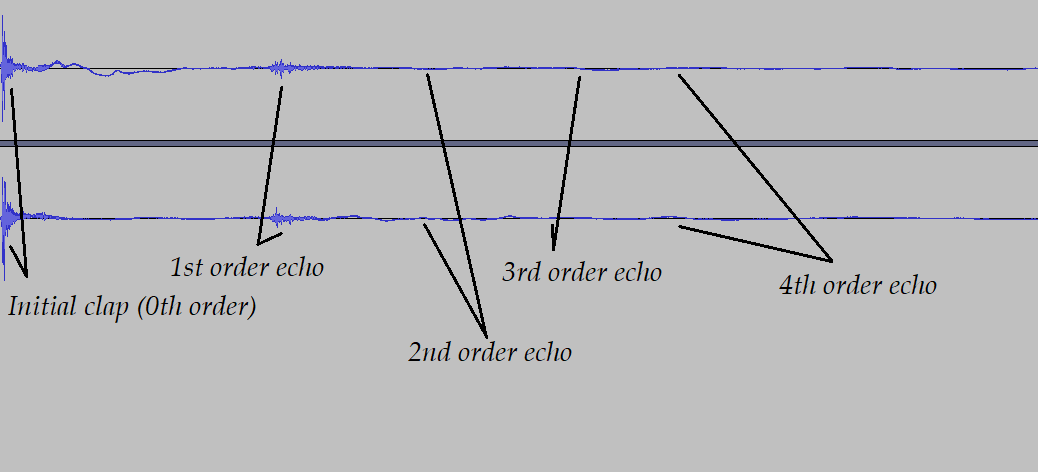
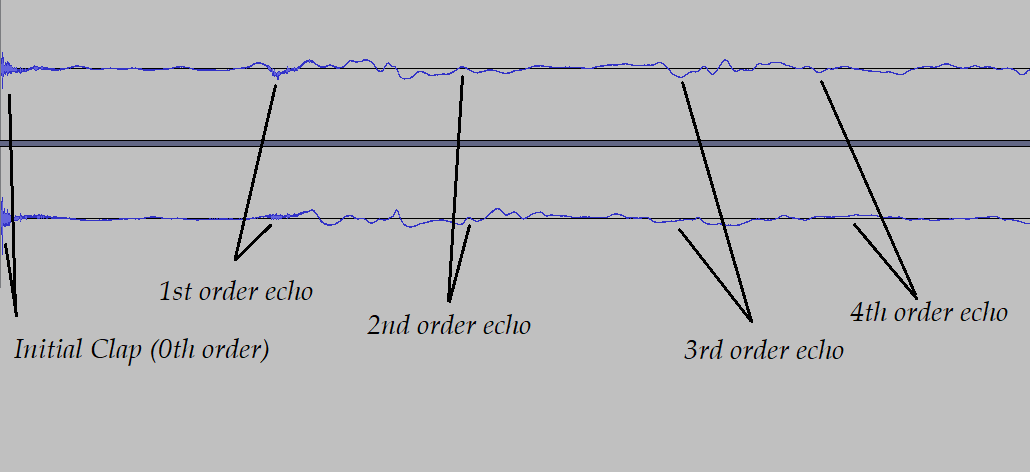
The annotated waveforms below identify the first four echoes and indicate their order.

Fig. 1. Annotated waveform for the first clap. The top waveform corresponds to the right channel, and the bottom to the left.

Fig. 2. Annotated waveform for the second clap. Note the significant anharmonic noise due to wind (which can be heard in the data above).

Fig. 3. Annotated waveform for the third clap. This was the "cleanest" of claps.

Fig. 4. Annotated waveform for the fourth clap.
In the table below, the time between each echo from the previous echo is recorded. The initial clap is set at t = 0.
| Clap # | 1st order echo time (s) | 2nd order echo time (s) | 3rd order echo time (s) | 4th order echo time (s) |
|---|---|---|---|---|
| 1 | 0.379 | 0.196 | 0.165 | 0.149 |
| 2 | 0.395 | 0.261 | 0.186 | 0.158 |
| 3 | 0.401 | 0.213 | 0.187 | 0.174 |
| 4 | 0.406 | 0.269 | 0.225 | 0.132 | Average | 0.39525 | 0.23475 | 0.19075 | 0.15325 |
Fig. 5. Plot of average echo time vs. echo order
We can find the decay factor (measured in dB per echo order) of the canyon by analyzing the intensity of the initial claps and the first-third-order echoes (the fourth order echo was too faint to accurately measure the intensity). The decay factor is average of the slope of the graphs below.
Fig. 6. Echo order vs dB for clap 1
Fig. 7. Echo order vs dB for clap 2
Fig. 8. Echo order vs dB for clap 3.
Fig. 9. Echo order vs dB for clap 4.
The decay factor was calculated to be -12.225 dB/echo order.
In addition to modulating the delay and amplitude of the input signal, and the amphitheater modulates the spectrum, acting as a low-pass filter. This can be seen below:
Fig. 10. In this plot of clap 1, the waveform and spectrum are plotted side-by-side. The intensity of frequencies is indicated by the red color. Note that the first-order echo is devoid of the 5000-8000 Hz frequencies abundant in the initial clap.
Since the peak of the initial clap was around 1000 Hz, the bandwidth (BW) is about three octaves:
Fig. 11. Zoomed-in spectrum of the initial clap and first-order echo for clap 1.
We see a similar ~three octave bandwidth (BW) for claps 2-4:
Fig. 12. Zoomed-in spectrum of the initial clap and first-order echo for clap 2.
Fig. 13. Zoomed-in spectrum of the initial clap and first-order echo for clap 3.
Fig. 14. Zoomed-in spectrum of the initial clap and first-order echo for clap 4.